R + Statistics = Best Friends

Statistical Analysis in R
Working with Strings
How to Build Software
Final Project Discussion
In this section, we're going to walk through all the steps of basic statistical analysis: getting data, exploring it, creating feature, building models, evaluating models, and comparing those models' performance.
We're going to work with R's swiss dataset. This cross-sectional dataset contains measures of fertility and some economic indicators collected in Switzerland in 1888. Our first task will be to load the data and immediately hold out a piece of it as testing data. The idea here is that when we evaluate the performance of our models later on, it will be better to do it on data that the models haven't seen. This will give a more honest picture of how well they might perform on new data.
In this exercise, we're going to evaluate the following question: Can we predict fertility based on regional socioeconomic characteristics?
Please follow along in "Statistical Analysis", in the programming supplement.
Once you've split your data into training and test, you should start poking it a bit to see if you find anything interesting
You can use str() to view the contents of your data objects, summary() to view some basic summary statistics on data frame columns, and cor() to get a correlation matrix between all pairs of numeric variables.
# Look at the structure
str(swiss)
## 'data.frame':    47 obs. of  6 variables:
##  $ Fertility       : num  80.2 83.1 92.5 85.8 76.9 76.1 83.8 92.4 82.4 82.9 ...
##  $ Agriculture     : num  17 45.1 39.7 36.5 43.5 35.3 70.2 67.8 53.3 45.2 ...
##  $ Examination     : int  15 6 5 12 17 9 16 14 12 16 ...
##  $ Education       : int  12 9 5 7 15 7 7 8 7 13 ...
##  $ Catholic        : num  9.96 84.84 93.4 33.77 5.16 ...
##  $ Infant.Mortality: num  22.2 22.2 20.2 20.3 20.6 26.6 23.6 24.9 21 24.4 ...
Hypothesis tests can be really helpful for discovering differences in datasets and evaluating relationships between variables.
One approach to looking for statistically interesting features (right-hand-side variables) involves binning those variables into "above median" and "below median", and using a paired t-test to see whether or not the variable is statistically related to the target.
# 1. Is fertility very different in provinces with above-median % of men in Agriculture
swiss$majority_agg <- swiss$Agriculture > median(swiss$Agriculture)
t.test(
  Fertility ~ majority_agg
  , data = swiss
)
For more, see "Hypothesis Testing" in the programming supplement.
Let's start fitting models!
Let's begin with a simple one-variable OLS regression, estimated using the lm() command.
# Simple regression: Fertility = f(Agriculture)
mod1 <- lm(
  Fertility ~ Agriculture
  , data = swiss
)
Once you have the fitted model, you can pass it and some new data to predict() to generate predictions.
Model evaluation metrics commonly used in regression problems:
The error metric calculations and plotting we just did seem general enough to apply to other models of this phenomenon. Since we could reuse the code for other models, we should just wrap it in a function so it's easy to call downstream.
Wrapping your analytics pipeline in a function has a few other benefits:
For more, see the "Wrap Parts of Your Pipeline in Functions" in the programming supplement.
To add more variables to a model in R, you have to use formula notation.
I've chosen specific right-hand side variables in this case, but if you want to say "all of the X variables", you can use . like Fertility ~ ..
# Fit
mod2 <- lm(
  Fertility ~ Education + Infant.Mortality + Examination_above_median
  , data = swiss
)

# Predict + Evaluate
regPreds2 <- EvaluateModel(
  mod2
  , testDF = swissTestDF
  , modelName = "Expanded OLS"
)
Linear regressions aren't the right tool when the relationships between the independent variables and the target are non-linear. In this situation, regression trees might perform better.
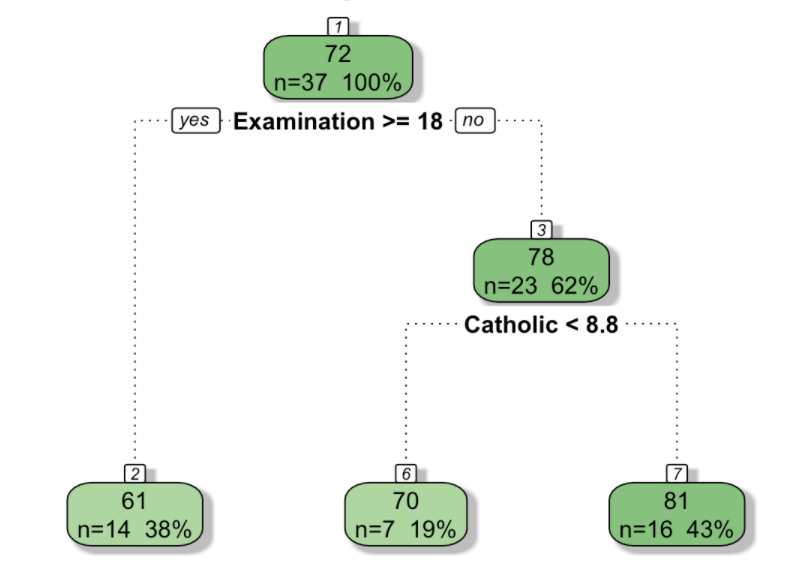
See A Visual Introduction to Machine Learning for a nice visual overview of the key concepts.
For larger datasets, you may find that a single decision tree does not perform well. It's common to use a "forest" of decision trees.
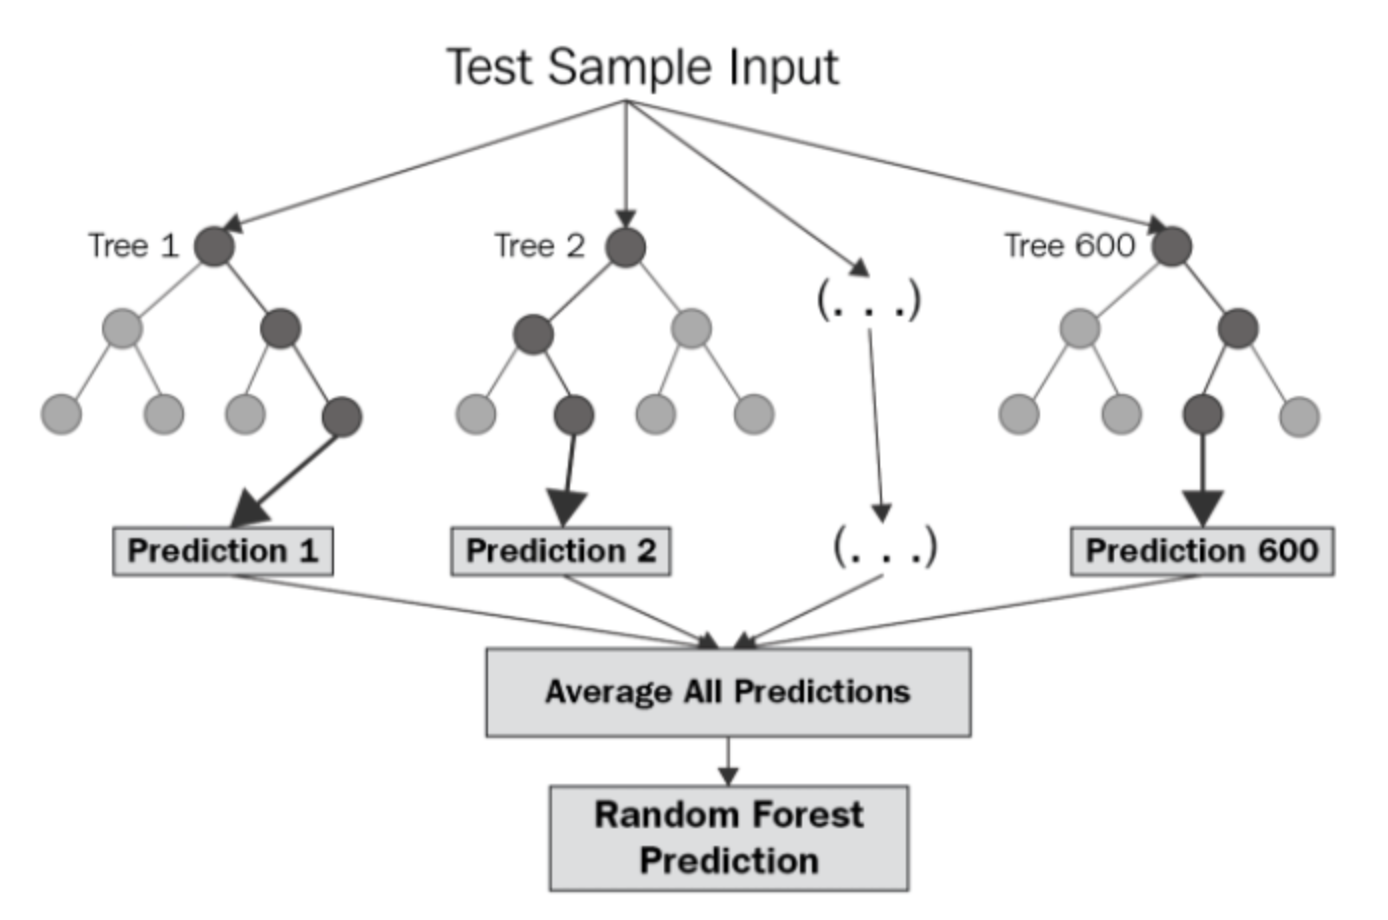
image credit: Vern Greenholt
See the "Random Forests" in the programming supplement for an example.
For a prediction tasks, you want the model that you think will perform best on new data. To get at this, you can compare how well different models perform on the held-out "test" dataset.
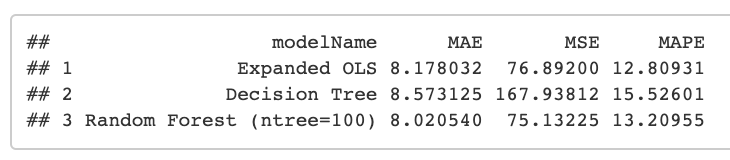
See the "Model Evaluation" in the programming supplement for an example.
In this section, we'll combine many of the techniques you've learned so far to show how R can be used to explore text data.
See "Text Processing" in the programming supplement.
Working with text often involves searching for patterns. Many programming languages can understand "regular expressions", a special format for expressing the pattern you want to find.
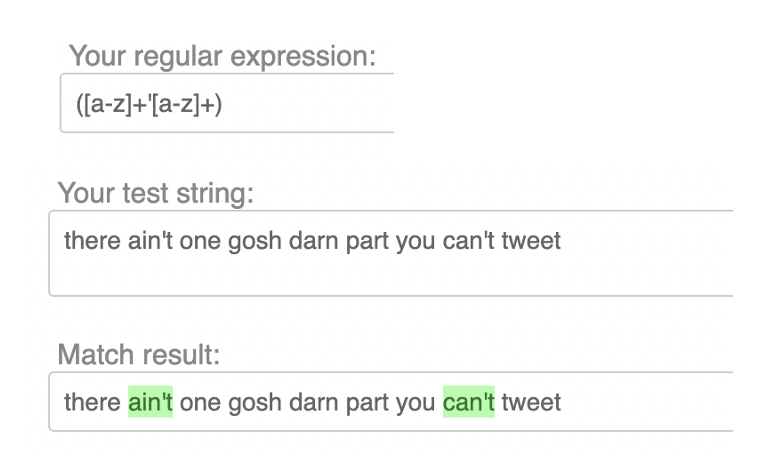
See "Regular Expressions" in the programming supplement.
The next task we need to accomplish is tokenizing our text, i.e. splitting lines and sentences into individual words. These individual words can then be used downstream to build a language model and identify key terms.
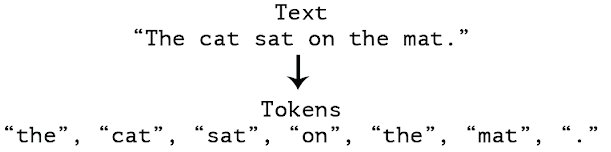
See "Tokenization" in the programming supplement.
OK so you have a business question, you've chosen your toolchain (presumably with R), and you have some data in hand. You sit down to write code and, well...
In this section, we'll to walk through the process of building a non-trivial script from scratch.
Resist the urge to just start writing code. Investing a few minutes upfront in thinking through the structure of your code will pay off in a big way as the project evolves and grows more complicated. Trust me.
First, just write down the main things you want to do. In this exercise, we're going to write some R code that can generate n-page "books" or random sentences in English.
#=== Write an R script that writes a book! ===#

# Function to create random sentences

# Function to create a "page" with n sentences

# Function to create a "book" with m pages

# Call the book function and create a 5-page book
Next, fill in the high-level outline with slightly more specifics. Try to strategize about the functions you'll need to implement and the individual steps that will have to happen inside each of those functions. This will probably change once you start writing code, but in my experience it's always easier to have a plan and change it.
You'll spend the most time on this and you will have to go through it many times before you're feeling comfortable with the code.
See "Pirate Book Example" in the programming supplement for an example.
For your final project, you'll be presenting your code to your classmates in a "code review" style presentation. This should be an informal conversation, not a formal presentation with slides.
Try to cover these main points:
Use this slide as a general reference of coding best practices.
library() calls at the top of your script(s)#===== Section 1 - Do Stuff =====# to separate major sections of the code:: (e.g. lubridate::ymd_hms())A sample script following these prescriptions is provided in "R Programming Best Practices", in the programming supplement.