Welcome back!

Programming Assignment 1 Review
Dealing with Missing Data
Visualizing Data
Combining and Transforming Data Frames
Final Project Discussion
IMHO, this assignment was the single hardest thing you'll be asked to do in this class.

NA is a special object in R, used to capture the idea of "a value whose value is unknown".
See ?NA for R's documentation on the nuances of NA
# Create a vector w/ missing data
some_nums <- c(1,2,NA, 6, NA, 8)
print(some_nums)
## [1] 1 2 NA 6 NA 8
# Use is.na() to get a vector of TRUE/FALSE for the question "is this element NA?"
is.na(some_nums)
## [1] FALSE FALSE TRUE FALSE TRUE FALSE
# Confirm that even w/ NAs, R still knows this is a numeric vector
class(some_nums)
## [1] "numeric"
NA values are not necessarily problems!
NA` can actually hold valuable information. For example, imagine that you get a dump of data from Salesforce or some other CRM system with information like customer_name, date_of_first_contact, and date_of_second_contact.
Depending on how the system was set up, date_of_second_contact1 may have dates only for customers who have been contacted at least twice, and be NA everywhere else. This is valuable information! If you want to build a model of 1-contact conversion, you could use the presence/absence of NA to help you identify the 1-contact customers that belong in your model.
The first approach you may take to dealing with NA values is to simply drop them from your data. If you don't think these missing data have any business value and your dataset is big enough that you can afford to drop some rows / columns, this is the right move for you.
# Removing NAs for vectors
top5 <- c("Wale", "Chance", NA, "Lupe Fiasco", "Shad", "Kanye", NA)
print(top5)
top5cleaned <- top5[!is.na(top5)]
print(top5cleaned)

# Removing rows with ANY NAs for data.frames
myDF <- data.frame(x = c(1, 2, NA, 4), y = c(NA, TRUE, FALSE, TRUE),
                   z = c("hey", "there", NA, "friends"))
cleanDF <- myDF[complete.cases(myDF), ]
You may find the "remove all the NAs everywhere" strategy a bit too aggressive for your use case. If you have a 100-variable dataset and a single variable (column) is 90\% NA values, do you really want to drop every row where that variable is NA? A better approach might be to selectively subset out columns where missing values are most severe before using complete.cases() to remove rows.
# Create a data frame where some variable have more NAs than others
testDF <- data.frame(var1 = sample(c(rnorm(99), NA), 200, replace = TRUE),
                     var2 = sample(c(rnorm(50), rep(NA, 50)), 200, replace = TRUE),
                     var3 = sample(c(rnorm(5), rep(NA, 95)), 200, replace = TRUE))

# Find columns that are more than 90% missing values
.percent_na <- function(a_vector){return(sum(is.na(a_vector)/length(a_vector)))}
colsToDrop <- apply(testDF, MARGIN = 2, .percent_na) > 0.9
cleanDF <- testDF[, !colsToDrop]

# Remove rows w/ remaining NAs
cleanDF <- cleanDF[complete.cases(cleanDF),]
A final strategy, particularly useful in modeling contexts, is to use some imputation strategy to replace NA values with reasonable alternatives. One common approach (and my favorite), the roughfix method. It works like this:
# Create a data frame where some variable have more NAs than others
testDF <- data.frame(var1 = sample(c(rnorm(99), NA), 500, replace = TRUE),
                     var2 = sample(c(rnorm(70), rep(NA, 30)), 500, replace = TRUE),
                     var3 = sample(c(rnorm(85), rep(NA, 15)), 500, replace = TRUE))

# Clean up w/ roughfix
library(randomForest)
cleanDF <- randomForest::na.roughfix(testDF)
R's built-in plotting tools, called "the base plotting system", is one of its most popular features.
The essential idea of the base plotting system is to build up plots in layers. You first create a simple plot, then "add on" a legend, more variables, other plot types, etc.
See "The Base Plotting System" in the programming supplement.
Let's start with a simple scatter plot to answer the question are sepal length and sepal width related?
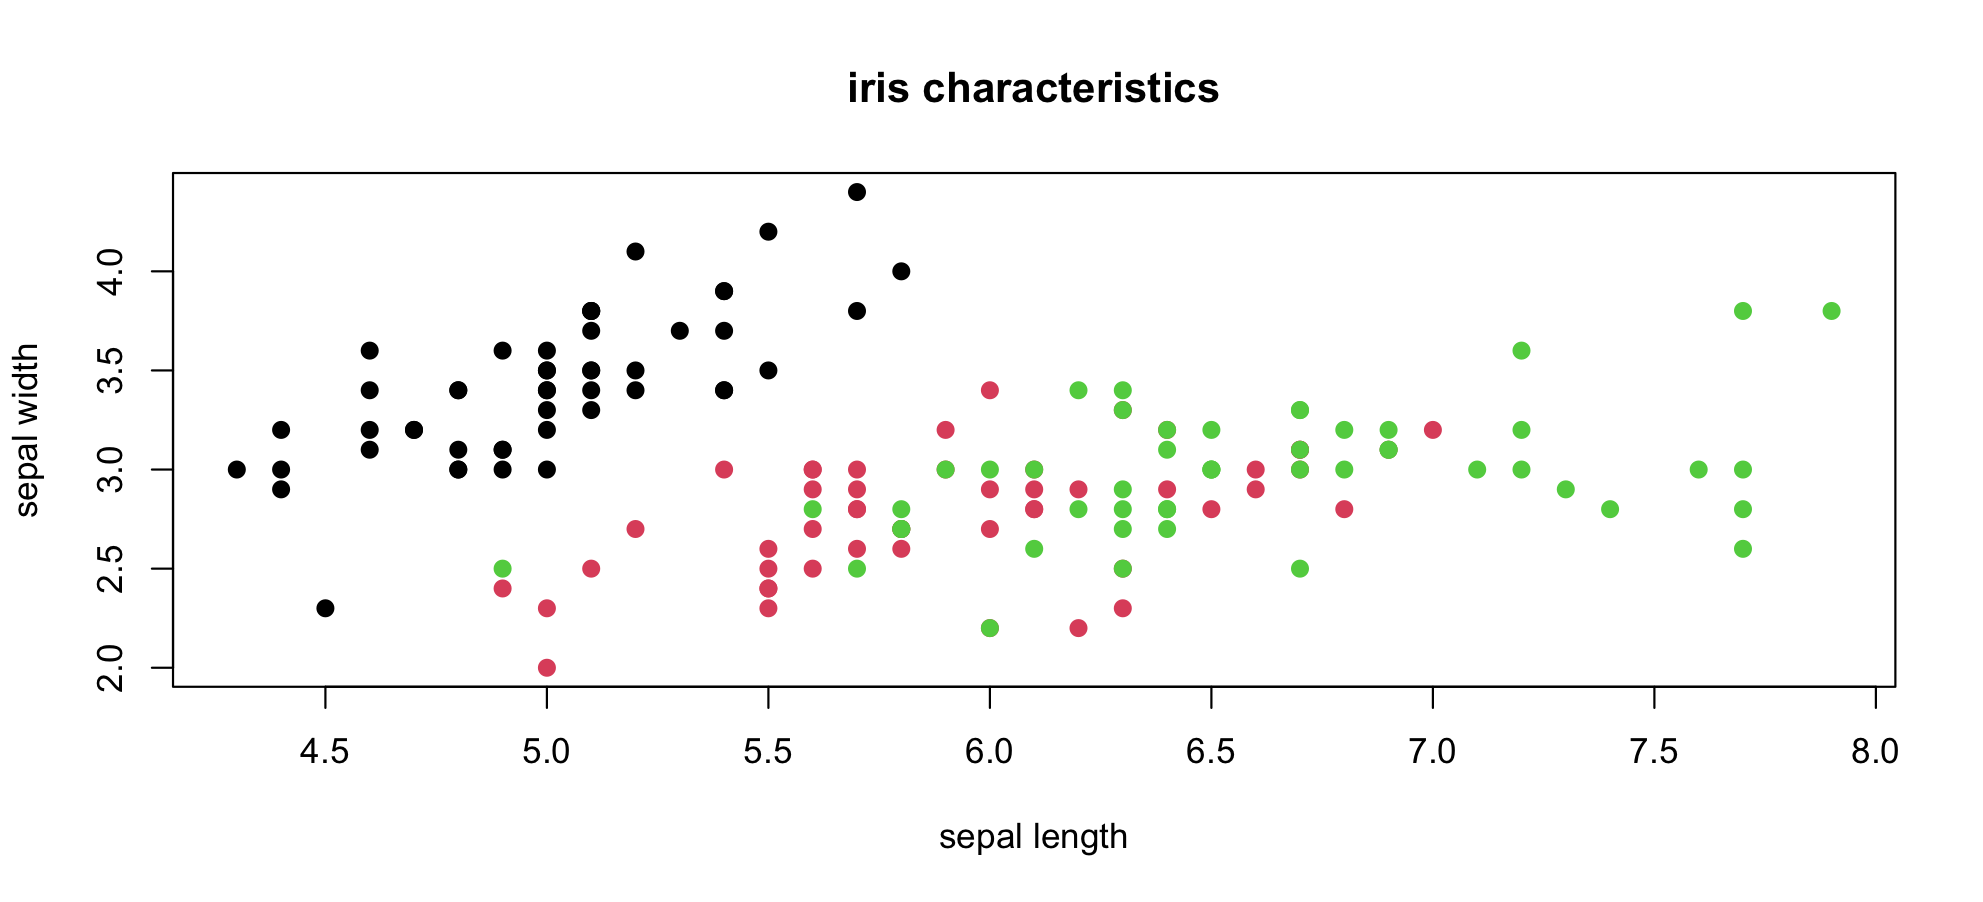
See "The Base Plotting System" in the programming supplement.
Histograms and densities are useful for examining distributions.
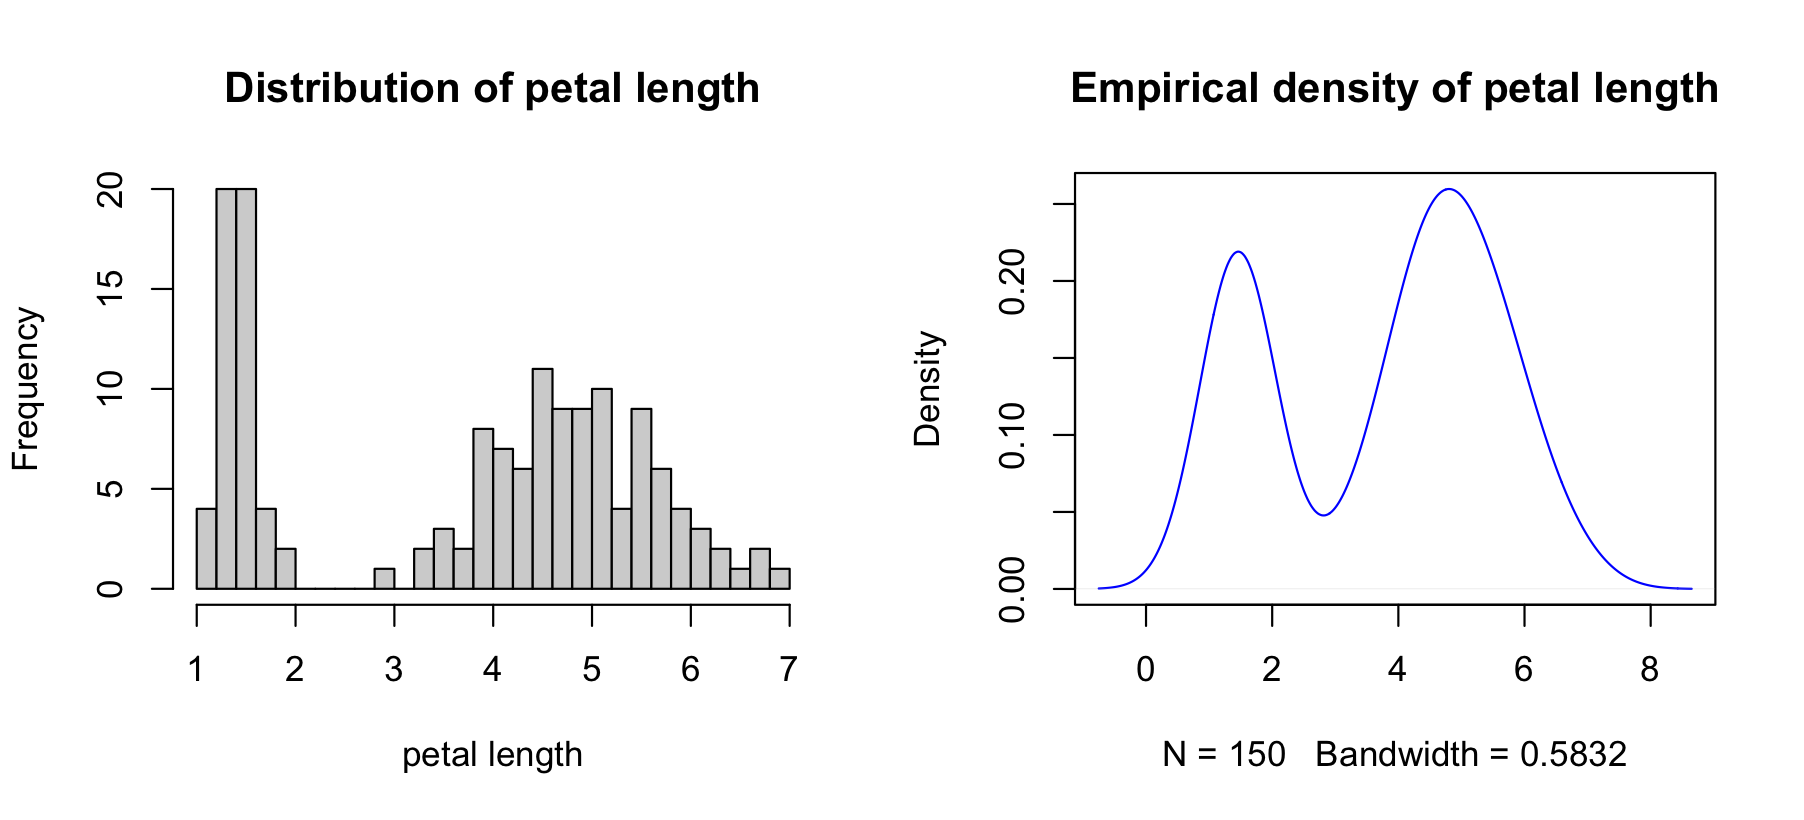
See "The Base Plotting System" in the programming supplement.
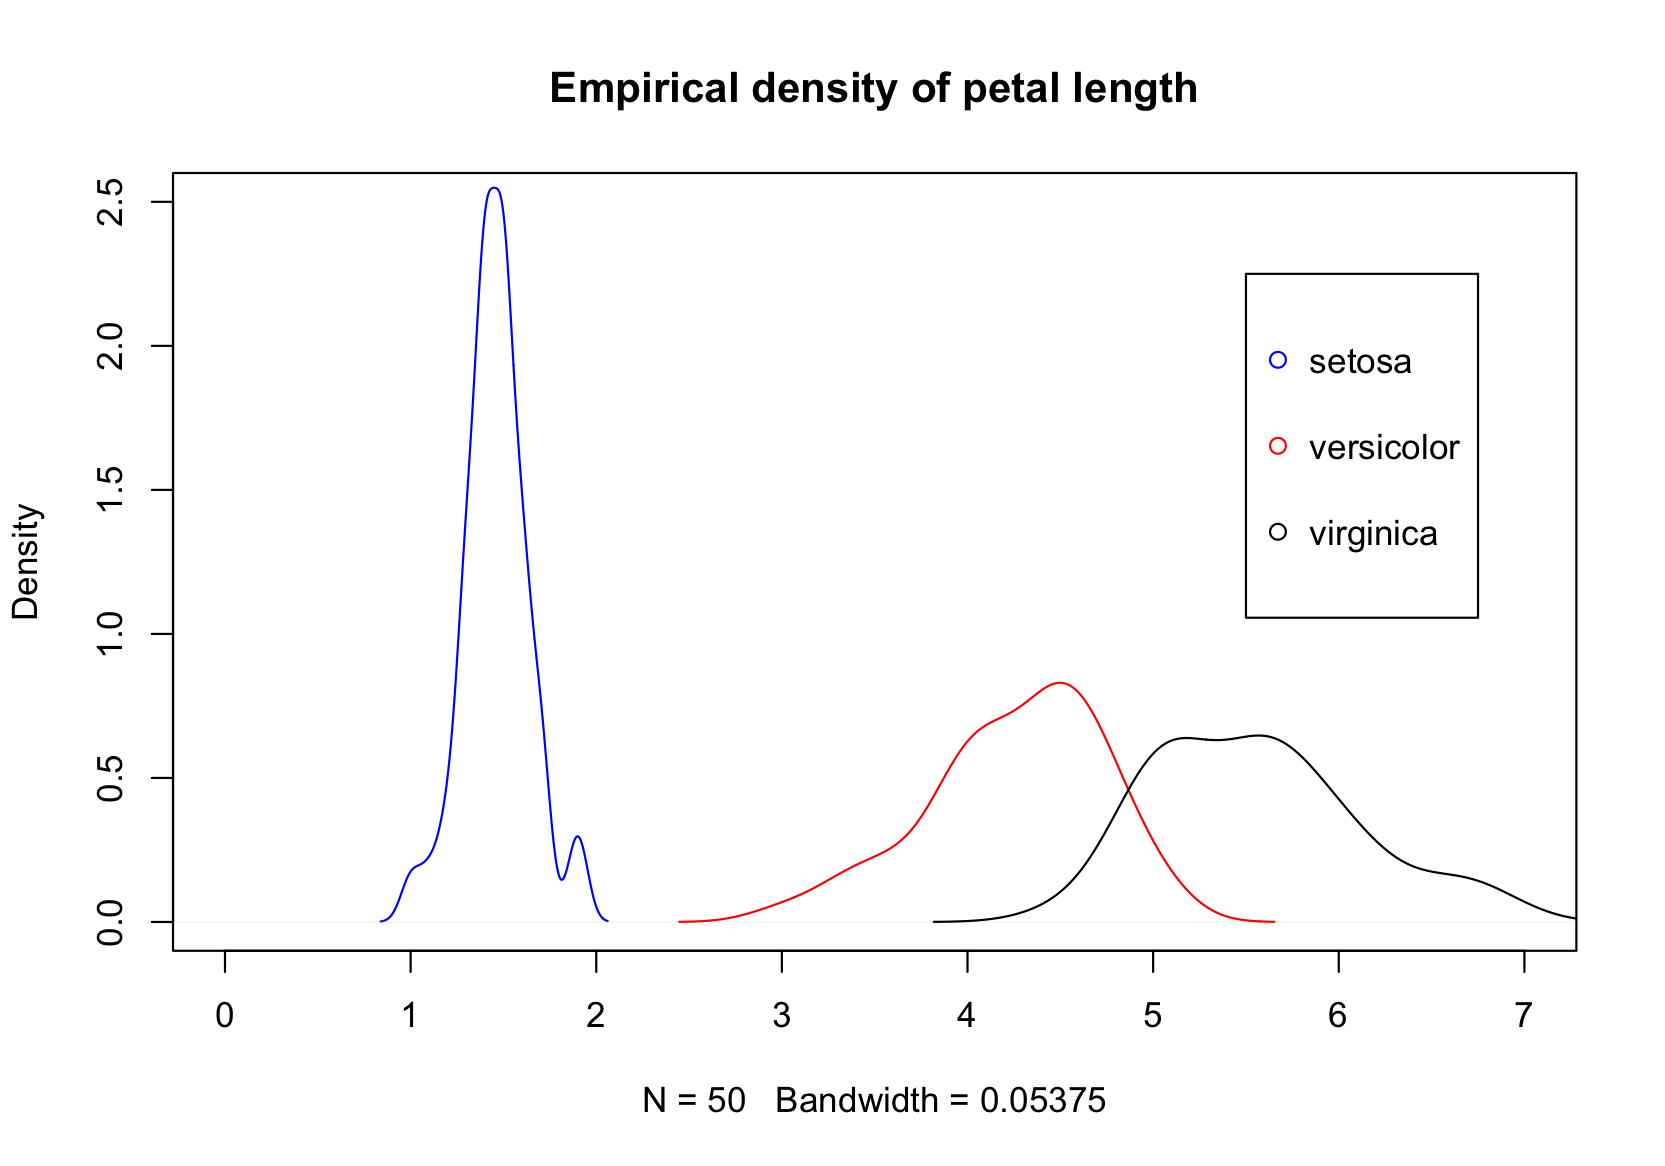
You can add more than one variable to these plots!
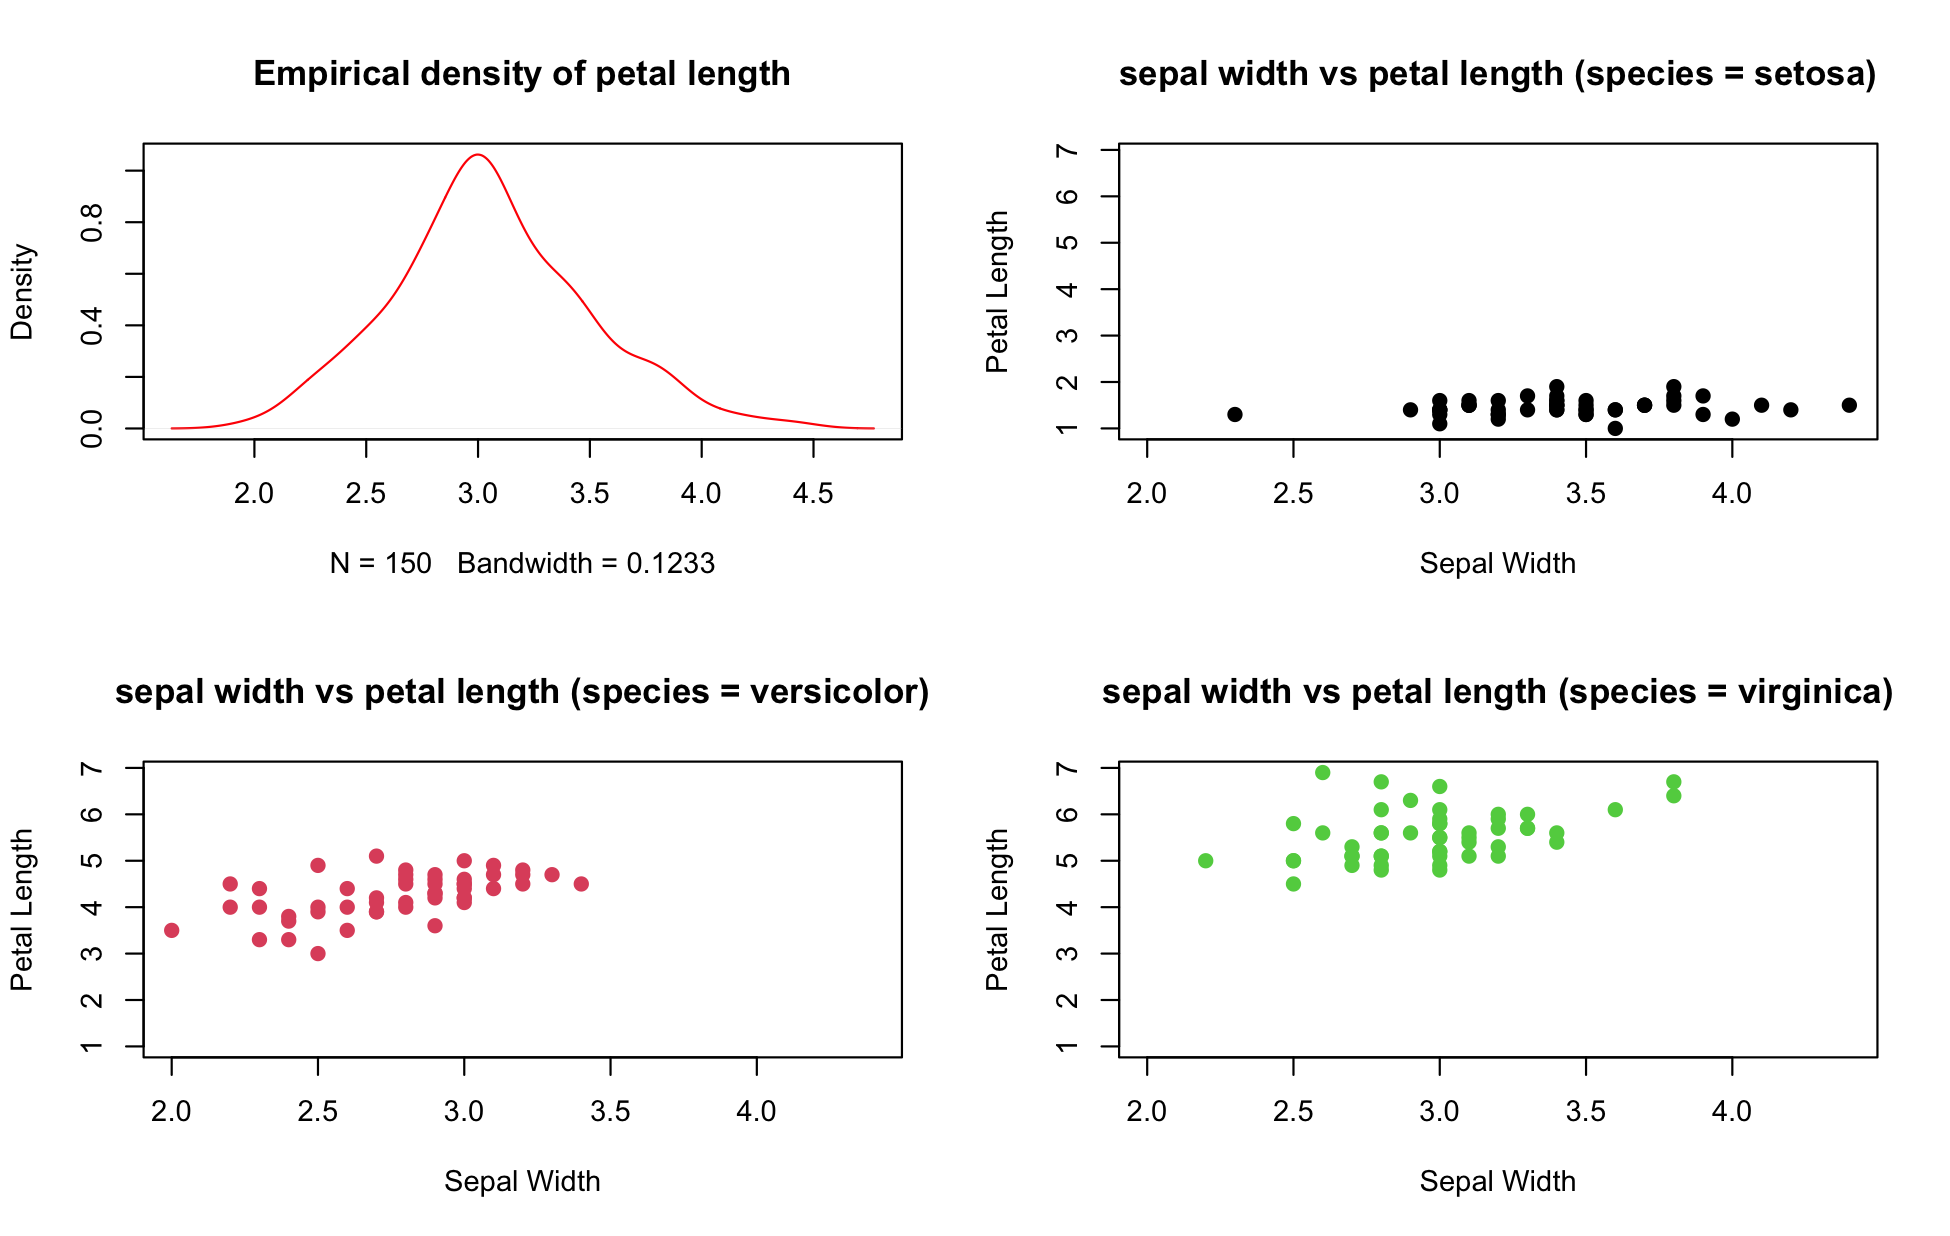
You can combine multiple plots in a grid layout. See "The Base Plotting System" for an example.
We don't have time in this short class to go into great depth on data visualization, but I want you to know that there are a bunch of cool visualization libraries a short install.packages() away!
When R (or any other program!) creates plots, it needs to know where to put them! When you call plot() or other commands from within and RStudio session, the default is to just display the resulting figure in the "Plots" pane. However, you can use other graphics devices (places to put visual output) to tell R to put your figures elsewhere.
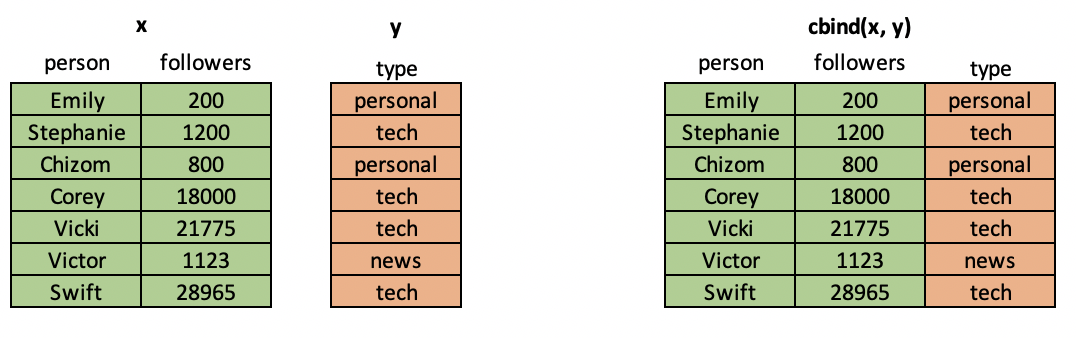
In situations where you have multiple data frames with the same rows but different columns, you can combine them column-wise with R's cbind() command. Note that this command will only work if the two data frames to be joined have the same number of rows AND those rows refer to the same observation.
cbind = "column-wise bind"
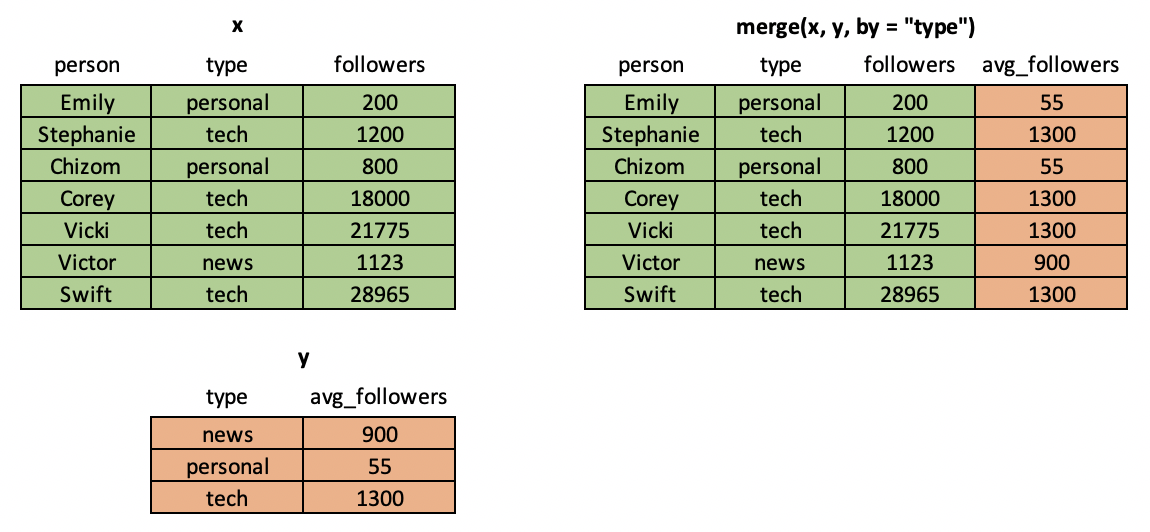
It's common in data science workflows to have two mismatched tables of data from different sources and to want to combine them by matching on one or more keys. Think JOIN in SQL or VLOOKUP in Excel. To perform this operation in R, you can use the merge() command.
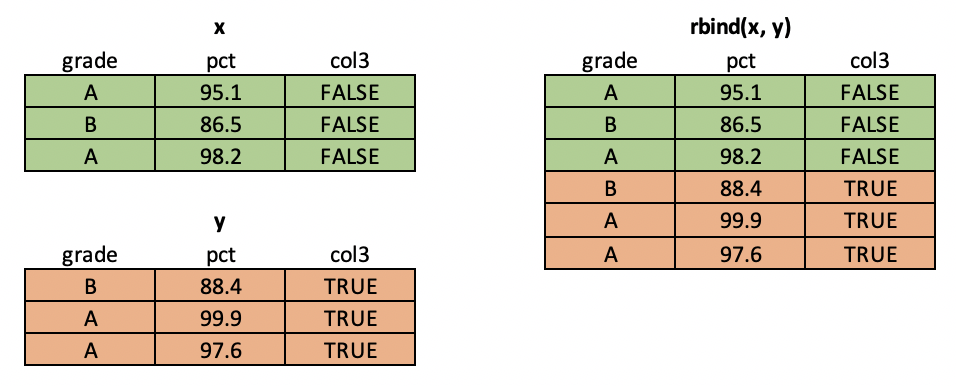
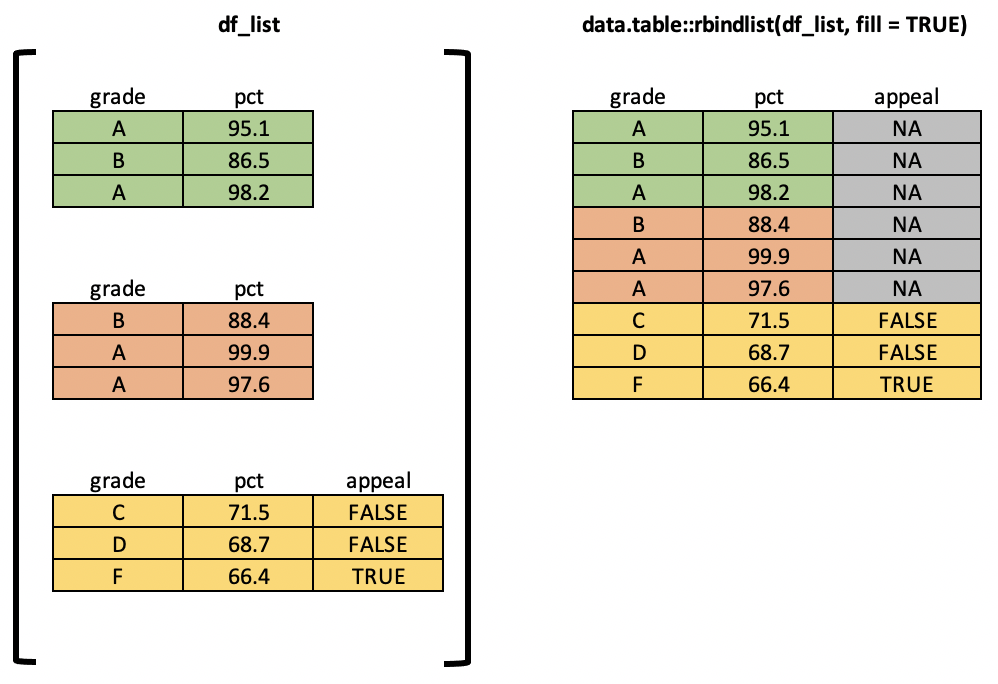
So far we've talked about merging columns from different tables. But what if you want to merge rows? For example, imagine that you are a researcher in a lab studying some natural phenomenon. You may take multiple samples (measuring the same variables) and then want to put them together into a single data frame to build a model. For this case, we can use R's rbind() function.
rbind = "row-wise bind"
What if you have 5 tables? 10? 1000? Use data.table::rbindlist().
Choosing External Packages
What Your Proposal Should Cover

Plotting in R: graphics devices
Paths: Relative vs absolute | listing files in a directory in R